Polynomials and art
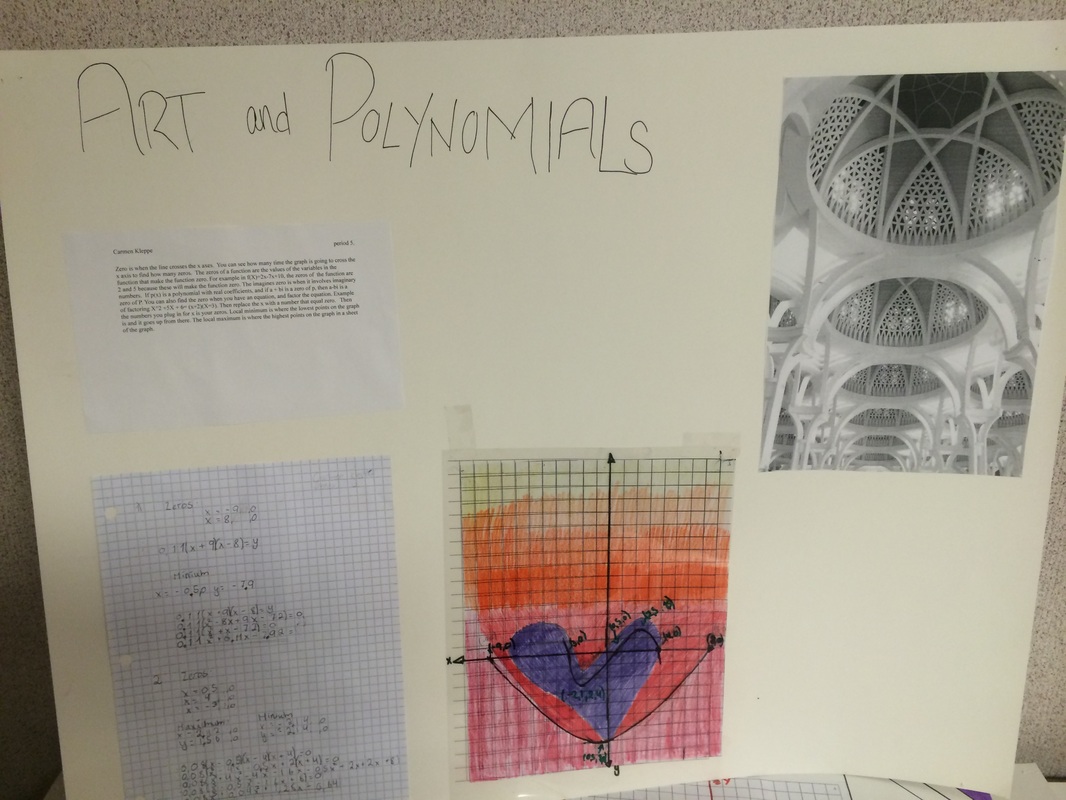
For this project we found polynomials of pictures. When we found the polynomials we traced them on a graphing transparency paper and label the local minimums and maximums, and label the x and y axis. We had to find the zeros by factoring the equations for polynomials. When we find the zeros and local minimums and maximums. We wrote them on a normal graph paper. We crated a picture by the polynomials. The point of the project was to make a new picture of the graph we got.
Written Piece:
Zero is when the line crosses the x axes. You can see how many time the graph is going to cross the x axis to find how many zeros. The zeros of a function are the values of the variables in the function that make the function zero. For example in f(X)=2x-7x+10, the zeros of the function are 2 and 5 because these will make the function zero. The imagines zero is when it involves imaginary numbers. If p(x) is a polynomial with real coefficients, and if a + bi is a zero of p, then a-bi is a zero of P. You can also find the zero when you have an equation, and factor the equation. Example of factoring X^2 +5X + 6= (x+2)(X=3). Then replace the x with a number that equal zero. Then the numbers you plug in for x is your zeros. Local minimum is where the lowest points on the graph is and it goes up from there. The local maximum is where the highest points on the graph in a sheet of the graph.
Project Reflection:
I think this project was hard mostly because I'm not very good at graphing. I liked doing the factor, and finding if we did it right. Mostly because then I knew that I understood how to do that. Also creating the picture was fun but challenge. Mostly because when you find your zeros, and made a line through the graph. Is was harder to create the picture. I'm not very artistic. We got our project back to do the corrections, right before the exhibition. I think that was bad, because we all forgot how to do it, I wish we did some review before getting our projects back.
Math the first term
This first semester has been hard and different. I think for me the hardest part of learning math in English are the term. I have always been told that math is the same in every country, but it's not. The most frustrating thing has to be that I know how to do it.But I don't know have to explain it. The same when I need help, I don't know how to explain what i'm struggling with. I have learn a lot this first semester. The projects we have had, I'm most proud of the Linear projects. I liked making my own word problem. even though I really struggle with graphing. I just don't understand about the graphing. But I did very good on the project.
